
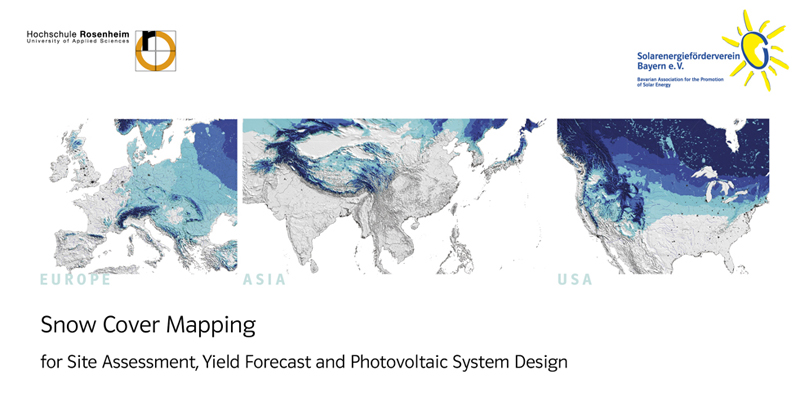
Snow Cover Mapping
This is the first long-term (10 years’ time series, 2006 to 2015) analyses of snow patterns.
Snow cover maps provide additional information for planning and simulating PV systems. Site assessment, yield estimate and simulations can be improved. A rough estimation of the yearly yield reduction indicates – for the PV systems considered – an annual yield decrease between 0.3 and 2.7 %.
Satellite based data has the advantage of being spatially comprehensive in contrast to ground measurement datasets which are interpolated. The presented maps are based on the NOAA/NESDIS dataset with a resolution of 4 by 4 km2 from 2006 to 2015. In order to quantify yield losses of PV plants, 10-years-monthly-average maps were produced in addition to the long-term annual average. Thereby, days on which snow is located on the panel can be combined with the global radiation more accurately. The results got validated with DWD climatology maps and match the satellite-based data very well.
Altitudes above 200 m. a. s. l. are covered with snow for about 40 days per year. In the Alps, the Black Forest, the Swabian Alb, the Franconian Jura, at the border region to Czech Republic, and in the Thuringian Forest the snow cover lasts more than 60 days, in higher elevations even more than 80 days. Yearly and monthly deviations get visible within this time window.